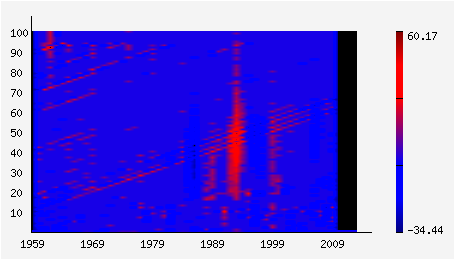
Infographics was born in the very exact moment when prehistoric man drew on the wall of the cave a buffalo and hunters, explaining something to his fellow tribesmen. Most probably, they have now proper language, but inforgraphics was already there. The years passed. At the turn of the last century, in 1912, the publishing house «Vestnik Zaninija» in St. Petersburg has published the book «
Rossija v cifrah. Strana. Narod. Soslovija. Klassy» (i.e. «
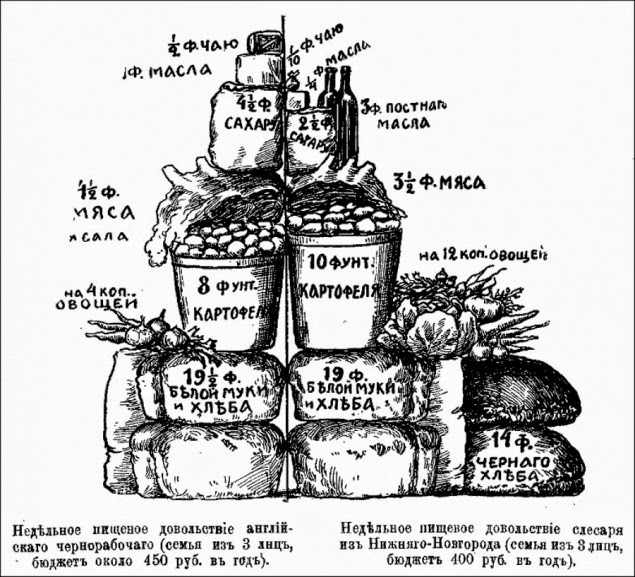
Russia in the figures. Country. People. Estates. Classes») authored by Nikolai Alexandrovich Rubakin. The book contains various statistical data on what was then the Russian Empire, as well as comparisons with other countries of the then World. It provides in particular revealing picture on weekly family budgets of English manual laborer (a family of 3 persons and an annual budget of 450 rubles) and locksmith from Nizhny Novgorod (family of 3 persons and an annual budget of 400 rubles).
Chart is in Russian, but it is easily understandable. English manual laborer is on left side and locksmith from Nizhny Novgorod is on right side. Labels from top to bottom reads as the following:
- Tea 1/2 lb vs 1/10 lb
- Butter 1 lb vs 1/2 lb
- Sugar 4 1/2 lb vs 2 1/2 lb
- Vegetable oil nil vs 3 lb
- Meat and lard 4 1/2 lb vs 3 1/2 lb
- Potatoes 8 lb vs 10 lb
- Vegetables (cost) 4 kop. vs 10 kop. (100 kop. = 1 ruble)
- White bread and flour 19 1/2 lb vs 19 lb
- Back bread nil vs 14 lb